
Understanding Financial Ratios for Investment Success
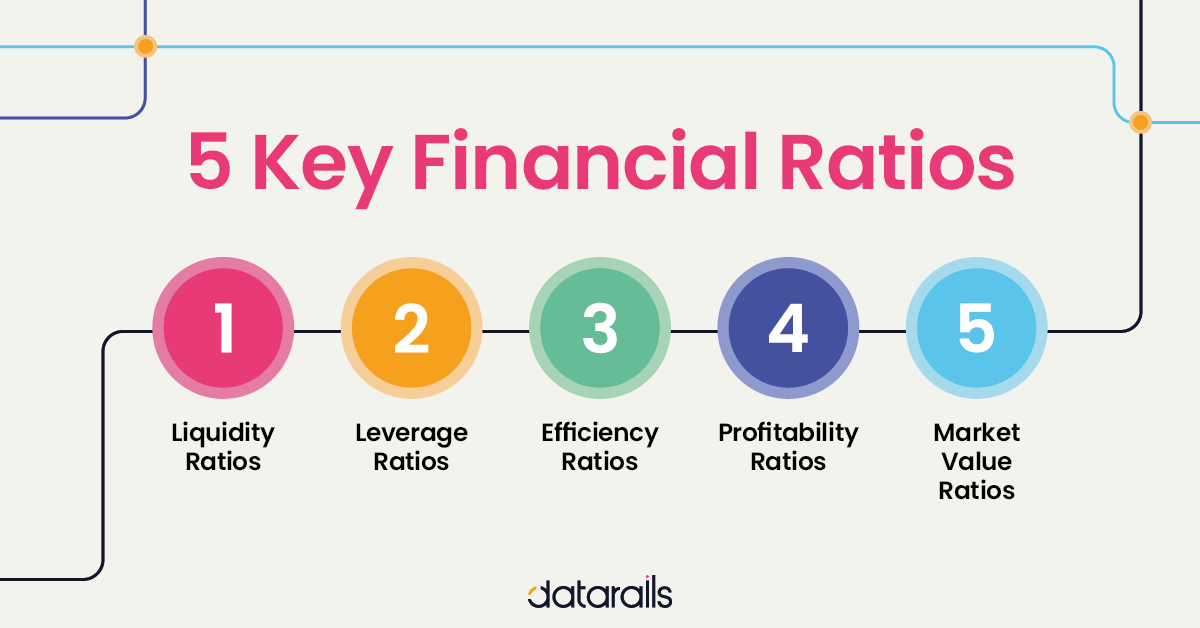
Financial ratios are powerful tools that investors can use to analyze a company's financial performance and make informed investment decisions. By comparing different ratios, investors can gain insights into a company's profitability, liquidity, solvency, and efficiency. This article explores various investment strategies that leverage financial ratios to identify promising investment opportunities and mitigate potential risks.
Key Financial Ratios and Their Significance
Before diving into specific investment strategies, it's crucial to understand the most important financial ratios and what they reveal about a company.
Profitability Ratios
Profitability ratios measure a company's ability to generate profits from its revenue and assets. These ratios are essential for evaluating a company's overall financial health and its ability to reward investors.
- Gross Profit Margin: (Gross Profit / Revenue) * 100. Indicates the percentage of revenue remaining after deducting the cost of goods sold. A higher margin suggests greater efficiency in production and pricing.
- Operating Profit Margin: (Operating Profit / Revenue) * 100. Measures the percentage of revenue remaining after deducting operating expenses. A higher margin indicates better control over operating costs.
- Net Profit Margin: (Net Profit / Revenue) * 100. Represents the percentage of revenue remaining after all expenses, including taxes and interest, have been deducted. This is a key indicator of overall profitability.
- Return on Assets (ROA): (Net Income / Total Assets) * 100. Measures how efficiently a company is using its assets to generate profit. A higher ROA indicates better asset management.
- Return on Equity (ROE): (Net Income / Shareholder Equity) * 100. Indicates how effectively a company is using shareholder investments to generate profit. A higher ROE is generally considered favorable.
Liquidity Ratios
Liquidity ratios assess a company's ability to meet its short-term obligations. These ratios are crucial for determining if a company has enough liquid assets to cover its immediate liabilities.
- Current Ratio: Current Assets / Current Liabilities. Indicates a company's ability to pay off its short-term liabilities with its current assets. A ratio of 1.5 to 2 is generally considered healthy.
- Quick Ratio (Acid-Test Ratio): (Current Assets - Inventory) / Current Liabilities. A more conservative measure of liquidity that excludes inventory, as it may not be easily converted into cash. A ratio of 1 or higher is often desired.
Solvency Ratios
Solvency ratios evaluate a company's ability to meet its long-term obligations. These ratios are important for assessing a company's financial stability and its ability to withstand financial distress.
- Debt-to-Equity Ratio: Total Debt / Shareholder Equity. Indicates the proportion of debt financing relative to equity financing. A lower ratio suggests less reliance on debt.
- Debt-to-Asset Ratio: Total Debt / Total Assets. Measures the proportion of a company's assets financed by debt. A lower ratio indicates a stronger financial position.
- Interest Coverage Ratio: Earnings Before Interest and Taxes (EBIT) / Interest Expense. Indicates a company's ability to cover its interest payments. A higher ratio suggests a greater ability to meet its debt obligations.
Efficiency Ratios
Efficiency ratios measure how effectively a company is using its assets and liabilities to generate revenue. These ratios are important for assessing a company's operational efficiency and its ability to manage its resources.
- Inventory Turnover Ratio: Cost of Goods Sold / Average Inventory. Indicates how quickly a company is selling its inventory. A higher ratio suggests efficient inventory management.
- Accounts Receivable Turnover Ratio: Revenue / Average Accounts Receivable. Measures how quickly a company is collecting payments from its customers. A higher ratio indicates efficient credit management.
- Asset Turnover Ratio: Revenue / Total Assets. Indicates how efficiently a company is using its assets to generate revenue. A higher ratio suggests better asset utilization.
Investment Strategies Using Financial Ratios
Now, let's explore some specific investment strategies that incorporate financial ratios.
Value Investing with P/E Ratio
The Price-to-Earnings (P/E) ratio is a widely used valuation metric that compares a company's stock price to its earnings per share (EPS). Value investors often look for companies with low P/E ratios relative to their industry peers or their historical averages. A low P/E ratio may indicate that a stock is undervalued and has the potential for future appreciation. However, it's crucial to consider the company's growth prospects and financial health before making an investment decision. A low P/E ratio could also signal underlying problems within the company.
Growth Investing with PEG Ratio
The Price/Earnings to Growth (PEG) ratio is a refinement of the P/E ratio that takes into account a company's expected earnings growth rate. It is calculated as P/E Ratio / Earnings Growth Rate. Growth investors often use the PEG ratio to identify companies with strong growth potential at a reasonable price. A PEG ratio of 1 is generally considered fair value, while a PEG ratio below 1 may indicate undervaluation. However, relying solely on the PEG ratio can be misleading, as it is based on estimated growth rates, which may not materialize.
Identifying Strong Companies with ROE and ROIC
Return on Equity (ROE) and Return on Invested Capital (ROIC) are powerful indicators of a company's profitability and efficiency in deploying capital. Investors often look for companies with consistently high ROE and ROIC compared to their industry peers. A high ROE suggests that the company is effectively using shareholder investments to generate profit, while a high ROIC indicates that the company is efficiently allocating capital to generate returns. Companies with strong ROE and ROIC are often considered to be well-managed and have a competitive advantage.
Screening for Financial Health with Debt Ratios
Debt ratios, such as the Debt-to-Equity ratio and the Interest Coverage ratio, are crucial for assessing a company's financial health and its ability to manage its debt obligations. Investors often screen for companies with low Debt-to-Equity ratios and high Interest Coverage ratios. A low Debt-to-Equity ratio suggests that the company is not overly reliant on debt financing, while a high Interest Coverage ratio indicates that the company has ample earnings to cover its interest payments. Companies with strong balance sheets and manageable debt levels are generally considered to be less risky investments.
Using the DuPont Analysis for a Deeper Dive
The DuPont analysis is a framework that breaks down ROE into three components: Net Profit Margin, Asset Turnover, and Financial Leverage (Equity Multiplier). This allows investors to identify the key drivers of a company's ROE and understand how it is generating its returns. For example, a company with a high ROE may be achieving it through high profit margins, efficient asset utilization, or excessive leverage. By analyzing each component of the DuPont analysis, investors can gain a more comprehensive understanding of a company's financial performance and identify potential areas of concern.
Combining Ratios for a Holistic View
It's important to remember that no single financial ratio should be used in isolation. A comprehensive investment strategy involves analyzing a combination of ratios to gain a holistic view of a company's financial performance. By considering profitability, liquidity, solvency, and efficiency ratios together, investors can make more informed investment decisions and mitigate potential risks. For example, a company with a high P/E ratio but also strong growth prospects, a healthy balance sheet, and efficient operations may still be a worthwhile investment.
The Importance of Industry Comparisons
When analyzing financial ratios, it's crucial to compare them to those of other companies within the same industry. Different industries have different characteristics and financial metrics. For example, a high Debt-to-Equity ratio may be acceptable for a utility company, which typically has stable cash flows, but not for a technology company, which may face more volatile demand. By comparing a company's financial ratios to its industry peers, investors can get a better sense of its relative performance and identify potential outliers.

0 Comments