
Understanding the Cash Flow Statement: A Vital Tool for Investors
The cash flow statement, often overlooked, is a critical financial statement that provides insights into a company's ability to generate cash. While the income statement reveals profitability and the balance sheet shows assets and liabilities, the cash flow statement focuses solely on the movement of cash both into and out of the company. Analyzing a cash flow statement effectively is essential for investors, creditors, and management alike to assess a company's financial health and sustainability. This guide will delve into the intricacies of a cash flow statement, providing you with the knowledge and tools to interpret it effectively.
The Three Sections of a Cash Flow Statement
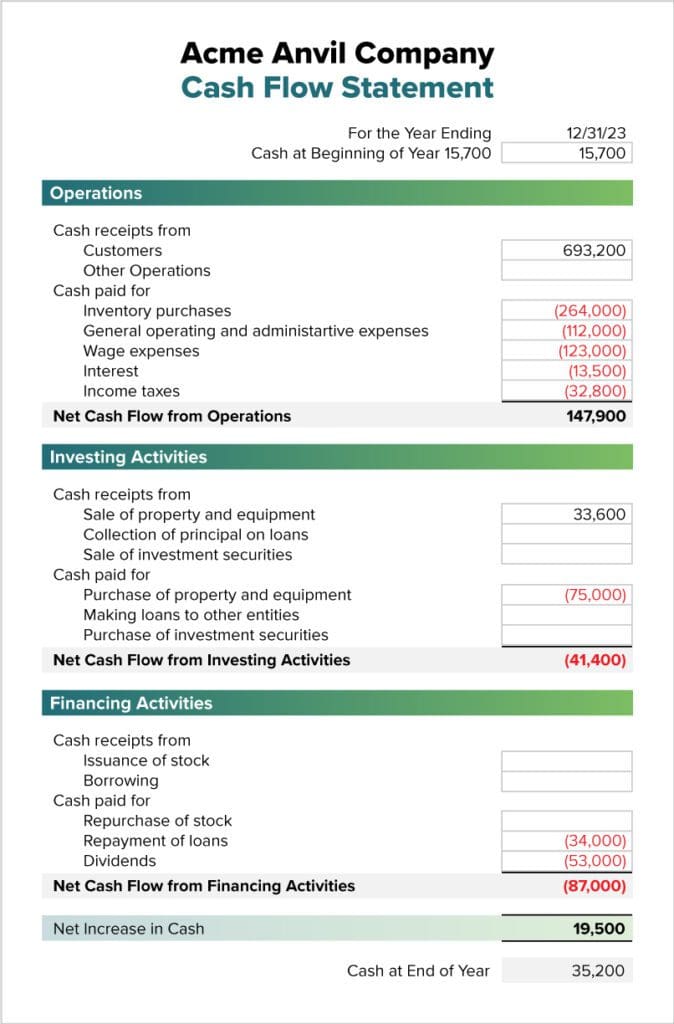
The cash flow statement is divided into three primary sections, each representing a different type of business activity:
- Cash Flow from Operating Activities (CFO): This section reflects the cash generated or used by the company's core business operations. It typically includes cash receipts from sales, cash payments for inventory, salaries, rent, and other operating expenses.
- Cash Flow from Investing Activities (CFI): This section reports cash flows related to the purchase and sale of long-term assets, such as property, plant, and equipment (PP&E), as well as investments in securities.
- Cash Flow from Financing Activities (CFF): This section includes cash flows related to debt, equity, and dividends. It reflects how the company is financing its operations, including borrowing money, issuing stock, and repaying debt.
Breaking Down Operating Activities
Understanding cash flow from operating activities (CFO) is paramount. A positive CFO generally indicates that a company is generating sufficient cash from its core business to fund its operations, while a negative CFO may signal potential financial distress. There are two primary methods for calculating CFO: the direct method and the indirect method.
The Direct Method
The direct method reports actual cash inflows and outflows from operating activities. It directly lists cash receipts from customers, cash payments to suppliers, cash payments for salaries, and other cash operating expenses. While conceptually simpler, the direct method is less commonly used because it requires detailed tracking of cash transactions, which can be time-consuming and costly.
The Indirect Method
The indirect method starts with net income and adjusts it for non-cash items and changes in working capital accounts to arrive at CFO. Non-cash items, such as depreciation and amortization, are added back to net income because they represent expenses that did not involve an actual outflow of cash. Changes in working capital accounts, such as accounts receivable, inventory, and accounts payable, are also adjusted to reflect the difference between reported net income and actual cash flow.
Key considerations when analyzing CFO:
- Consistent Positive CFO: Ideally, a company should consistently generate positive cash flow from operating activities. This indicates that its core business is sustainable and capable of generating cash to cover its expenses and investments.
- Trends in CFO: Analyze the trend of CFO over time. Is it increasing, decreasing, or stable? A declining CFO could be a warning sign of potential problems.
- CFO vs. Net Income: Compare CFO to net income. If CFO is consistently lower than net income, it may indicate that the company is relying on accounting accruals rather than actual cash receipts. This could be a red flag.
Analyzing Investing Activities
Cash flow from investing activities (CFI) reflects a company's investments in long-term assets. A negative CFI typically indicates that the company is investing in its future growth by acquiring assets such as property, plant, and equipment. A positive CFI may indicate that the company is selling off assets, which could be a sign of financial distress or a strategic shift.
Key considerations when analyzing CFI:
- Capital Expenditures (CAPEX): Significant capital expenditures (purchases of PP&E) are generally a sign that a company is investing in its future. However, it's important to analyze whether these investments are generating a sufficient return.
- Acquisitions and Divestitures: Analyze any acquisitions or divestitures of businesses. These transactions can have a significant impact on a company's cash flow.
- Investments in Securities: Track investments in marketable securities. These investments can provide a source of cash flow, but they also carry risk.
Understanding Financing Activities
Cash flow from financing activities (CFF) reflects how a company is financing its operations. This section includes cash inflows from borrowing money and issuing stock, as well as cash outflows for repaying debt, repurchasing stock, and paying dividends.
Key considerations when analyzing CFF:
- Debt Levels: Analyze the company's debt levels. High debt levels can increase financial risk, but debt can also be a cost-effective way to finance growth.
- Equity Issuances and Repurchases: Track issuances and repurchases of stock. Issuing stock dilutes existing shareholders' ownership, while repurchasing stock can increase earnings per share.
- Dividend Payments: Analyze dividend payments. Consistent dividend payments can be a sign of financial stability, but cutting dividends can be a warning sign of financial distress.
Key Ratios and Metrics for Cash Flow Analysis
Several key ratios and metrics can be used to analyze a company's cash flow statement:
- Free Cash Flow (FCF): FCF is the cash flow available to the company after it has paid for its capital expenditures. It is calculated as CFO less capital expenditures. FCF is a key indicator of a company's financial health and its ability to generate cash for future growth, acquisitions, or dividend payments.
- Current Ratio: While not directly from the cash flow statement, it's impacted by cash management. It is calculated as Current Assets / Current Liabilities and indicates a company's ability to pay short-term obligations.
- Cash Flow Coverage Ratio: This ratio measures a company's ability to cover its debt obligations with its cash flow. It is calculated as CFO / Total Debt. A higher ratio indicates a stronger ability to repay debt.
- Cash Flow to Debt Ratio: This ratio measures a company's ability to pay off its total debt with its cash flow from operations. It's calculated as CFO / Total Debt.
Putting it All Together: A Holistic Approach
Analyzing a cash flow statement in isolation is not sufficient. It's crucial to integrate the cash flow statement with the income statement and balance sheet to gain a comprehensive understanding of a company's financial performance. For example, compare the trends in CFO with the trends in net income and revenue. Also, analyze the company's cash flow in relation to its industry peers. Is the company generating more or less cash than its competitors? Are its capital expenditures higher or lower? By taking a holistic approach, you can gain a much deeper understanding of a company's financial health and its prospects for future growth.

0 Comments