
Introduction to Cryptocurrency Chart Analysis
The world of cryptocurrency trading can seem daunting, especially for newcomers. Understanding how to analyze cryptocurrency charts and trends is crucial for making informed investment decisions. This guide will provide you with the fundamental knowledge and techniques needed to interpret crypto charts effectively and identify potential trading opportunities. We'll explore various chart types, key indicators, and popular chart patterns that can help you navigate the volatile crypto market.
Understanding Different Types of Crypto Charts
Several types of charts are commonly used in cryptocurrency analysis, each offering a unique perspective on price movements. Understanding their strengths and weaknesses is essential for choosing the right chart for your analysis.
Line Charts
Line charts are the simplest type of chart, connecting closing prices over a specified period. They provide a clear visual representation of the overall trend but lack detailed information about price fluctuations within each period. Line charts are best used for identifying long-term trends and getting a general overview of price action.
Bar Charts
Bar charts provide more information than line charts, displaying the open, high, low, and close prices for each period. The vertical bar represents the price range, with a small horizontal line indicating the open price on the left and the close price on the right. Bar charts offer a more detailed view of price action within each period, allowing traders to identify potential support and resistance levels.
Candlestick Charts
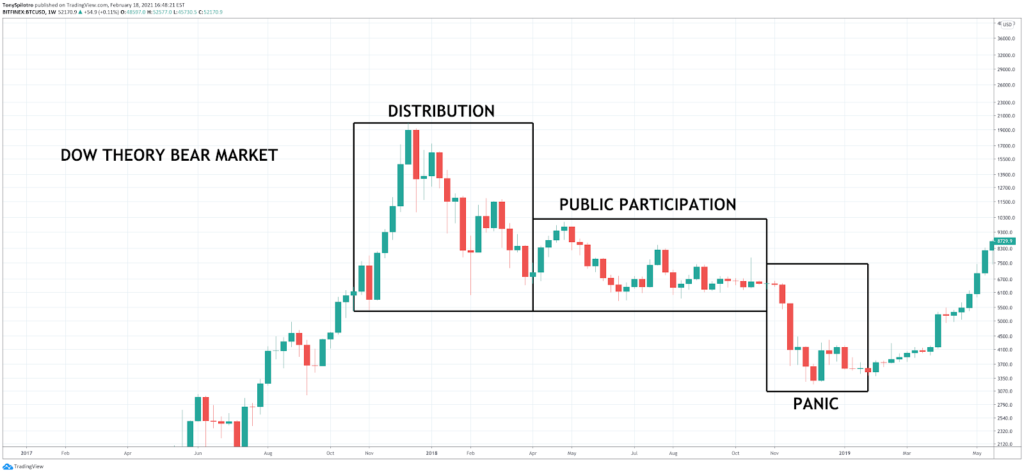
Candlestick charts are the most popular type of chart used by crypto traders. Similar to bar charts, they display the open, high, low, and close prices for each period. However, instead of using a bar, they use a "candle" to represent the price range. The body of the candle represents the difference between the open and close prices. If the close price is higher than the open price, the body is typically green or white (indicating a bullish candle). If the close price is lower than the open price, the body is typically red or black (indicating a bearish candle). Candlestick charts are visually appealing and can help traders quickly identify potential reversal patterns.
Key Technical Indicators for Crypto Analysis
Technical indicators are mathematical calculations based on historical price and volume data. They are used to identify potential trading signals, confirm trends, and gauge the strength of price movements. Here are some of the most commonly used technical indicators in cryptocurrency analysis:
Moving Averages (MA)
Moving averages smooth out price data by calculating the average price over a specified period. They help to identify the overall trend and potential support and resistance levels. Common moving average periods include 50-day, 100-day, and 200-day moving averages. Traders often use moving average crossovers (when a shorter-term moving average crosses a longer-term moving average) as buy or sell signals.
Relative Strength Index (RSI)
The Relative Strength Index (RSI) is a momentum oscillator that measures the speed and change of price movements. It ranges from 0 to 100 and is used to identify overbought and oversold conditions. An RSI reading above 70 typically indicates an overbought condition, suggesting a potential price reversal to the downside. An RSI reading below 30 typically indicates an oversold condition, suggesting a potential price reversal to the upside.
Moving Average Convergence Divergence (MACD)
The Moving Average Convergence Divergence (MACD) is a trend-following momentum indicator that shows the relationship between two moving averages of prices. The MACD line is calculated by subtracting the 26-period Exponential Moving Average (EMA) from the 12-period EMA. A signal line, which is a 9-period EMA of the MACD line, is also plotted. Traders often use MACD crossovers (when the MACD line crosses above or below the signal line) as buy or sell signals. They also look for divergences between the MACD and price action to identify potential trend reversals.
Volume
Volume represents the number of shares or contracts traded during a specific period. It is a crucial indicator of market activity and can confirm the strength of a trend. Increasing volume during an uptrend suggests strong buying pressure, while increasing volume during a downtrend suggests strong selling pressure. Low volume can indicate a weak trend or a potential reversal.
Recognizing Common Crypto Chart Patterns
Chart patterns are recognizable formations on price charts that can provide clues about future price movements. Learning to identify these patterns can help traders anticipate potential breakouts, reversals, and continuations of trends.
Head and Shoulders
The head and shoulders pattern is a bearish reversal pattern that signals the end of an uptrend. It consists of three peaks: a head (the highest peak) flanked by two shoulders (lower peaks). A neckline connects the lows between the peaks. A break below the neckline confirms the pattern and suggests a potential downtrend.
Inverse Head and Shoulders
The inverse head and shoulders pattern is a bullish reversal pattern that signals the end of a downtrend. It is the opposite of the head and shoulders pattern, with three troughs: a head (the lowest trough) flanked by two shoulders (higher troughs). A neckline connects the highs between the troughs. A break above the neckline confirms the pattern and suggests a potential uptrend.
Double Top and Double Bottom
A double top is a bearish reversal pattern that occurs when the price reaches a high twice, failing to break through the resistance level. This indicates that buyers are losing momentum, and a downtrend may be imminent. A double bottom is a bullish reversal pattern that occurs when the price reaches a low twice, failing to break through the support level. This indicates that sellers are losing momentum, and an uptrend may be imminent.
Triangles (Ascending, Descending, and Symmetrical)
Triangles are continuation patterns that indicate a period of consolidation before the price continues in the direction of the prevailing trend. Ascending triangles are bullish patterns with a flat upper trendline and a rising lower trendline. Descending triangles are bearish patterns with a flat lower trendline and a falling upper trendline. Symmetrical triangles have converging trendlines and can break out in either direction.
Combining Indicators and Patterns for Effective Crypto Analysis
While individual indicators and patterns can provide valuable insights, it's essential to combine them for a more comprehensive analysis. Using multiple indicators and patterns can help to confirm trading signals and reduce the risk of false signals. For example, you might look for a head and shoulders pattern forming at the same time as the RSI is indicating an overbought condition. This combination of signals would provide stronger confirmation of a potential downtrend.
Risk Management in Cryptocurrency Trading
Analyzing charts and trends is only one part of successful cryptocurrency trading. Effective risk management is equally important. Always use stop-loss orders to limit potential losses and only invest what you can afford to lose. Diversify your portfolio to spread risk across multiple cryptocurrencies. Remember that the cryptocurrency market is highly volatile, and even the best analysis cannot guarantee profits.

0 Comments